JEPQ and QQQI vs DIY QQQ Covered Calls
Covered call ETFs such as JEPQ and QQQI package a Nasdaq-100 income strategy into a single ticker. How do they compare with simply holding QQQ, and with writing covered calls on QQQ yourself?
We compared JEPQ and QQQI against QQQ over each fund’s available history, then looked at those results next to a 5-year grid of DIY QQQ covered call strategies.
Scope and caveats
This is a practical comparison, not a perfect same-window replication:
- JEPQ starts in May 2022, midway through the bear market, giving about 4.2 years of history.
- QQQI starts in January 2024, giving about 2.5 years of history.
- The DIY QQQ grid covers 5 years and is gross of transaction costs and taxes.
JEPQ vs QQQ
Full available history, May 2022 to July 2026:
| Total return | Annualised return | Monthly Sortino | |
|---|---|---|---|
| JEPQ | +87.0% | +16.1% | 2.17 |
| QQQ | +124.2% | +21.2% | 2.34 |
JEPQ gave up a meaningful amount of upside, an annualised drag of -5.1% a year versus QQQ, and also lagged QQQ on monthly Sortino. Part of this is timing: JEPQ launched midway through the 2022 bear market, missing much of the decline in which an income strategy would have been expected to shine, and this is reflected in the lower Sortino.
QQQI vs JEPQ vs QQQ
QQQI’s full available history runs from January 2024 to July 2026. To make the fund comparison cleaner, JEPQ is matched to that same window:
| Total return | Annualised return | Monthly Sortino | |
|---|---|---|---|
| QQQ | +71.5% | +24.6% | 3.87 |
| QQQI | +57.1% | +20.2% | 3.98 |
| JEPQ | +51.5% | +18.5% | 3.38 |
QQQI lagged QQQ on total return, an annualised drag of -4.4% a year, but slightly beat it on monthly Sortino. Against JEPQ directly, QQQI came out ahead on total return, annualised return and monthly Sortino.
Both funds lagged QQQ on total return, but over the period where both were live, QQQI looked more efficient than JEPQ on a risk-adjusted basis.
DIY QQQ covered calls
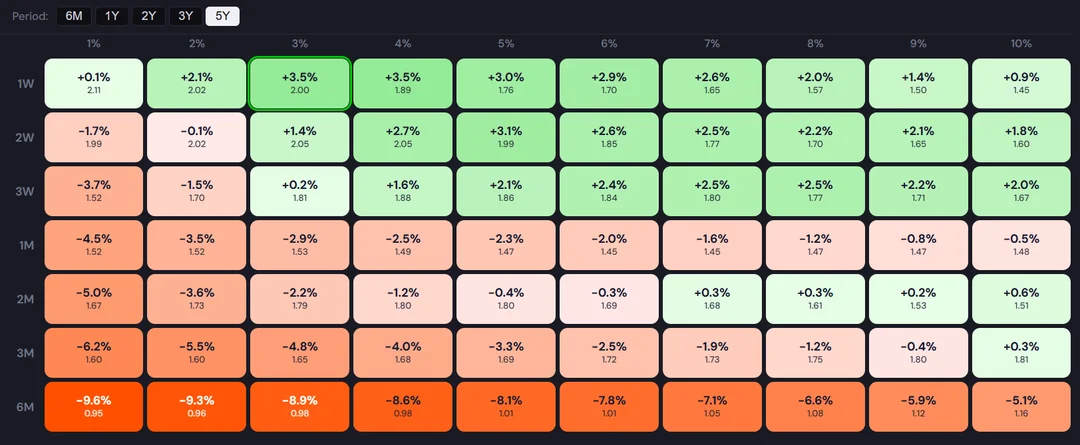
The heatmap grid shows systematic QQQ covered call strategies over 5 years:
- columns = strike distance from spot, 1% to 10% out of the money;
- rows = tenor, from 1 week to 6 months;
- the large number = annualised return versus simply holding QQQ;
- the small number = monthly Sortino ratio.
For reference, QQQ alone had a monthly Sortino of 1.23 over the same 5-year period.
Short-dated strategies
Several short-dated strategies had a much higher Sortino than QQQ while also outperforming it on annualised return. The strongest area was:
| Strategy | vs QQQ, annualised | Monthly Sortino |
|---|---|---|
| 1 week, 3% OTM | +3.5% | 2.00 |
| 1 week, 4% OTM | +3.5% | 1.89 |
| 2 weeks, 4% OTM | +2.7% | 2.05 |
| 2 weeks, 5% OTM | +3.1% | 1.99 |
| 3 weeks, 6% to 8% OTM | ~+2.4% to +2.5% | ~1.77 to 1.84 |
These short-dated out-of-the-money cells did not just beat QQQ on return: they also had materially better monthly Sortino than QQQ’s 1.23 baseline.
Longer-dated strategies
The longer-dated cells were much weaker. The 6-month tenor underperformed across the whole grid, at around -9.6% to -5.1% a year versus QQQ, with a Sortino of only about 0.95 to 1.16, below QQQ.
Takeaways
JEPQ and QQQI both lagged QQQ on total return over their available histories, which is expected for income strategies in a strong Nasdaq market. But QQQI looked more efficient than both JEPQ and QQQ on a risk-adjusted basis, at least by monthly Sortino.
Against the 5-year DIY grid, the best simple QQQ covered call rules beat QQQ on both return and Sortino, but those results were concentrated in the short-dated range.
- JEPQ and QQQI are convenient implementations, but the upside drag is real.
- QQQI looked more efficient than JEPQ over the period where both were live, with higher return and higher monthly Sortino.
- The best DIY QQQ covered call cells had both higher return and higher Sortino than QQQ alone.
- But those best-looking DIY cells are also where implementation matters most: rolling frequency, execution, taxes and spreads.
This publication is provided for informational purposes only. It does not constitute investment advice, an offer or a recommendation to buy or sell any financial instrument. Past and simulated performance is not indicative of future results.
Historical backtest observations for research and education only. Not investment advice; past performance does not guarantee future results.
Run this analysis on any stock or ETF.
Join the Private Beta